Quantity for last 30 days
+30.00%
+68.57%
+11.37%
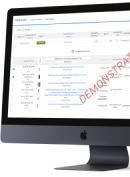
This section showcases the real-time statistics of our
software in use
across all the warehouses that have implemented it.
The figures below represent key metrics and usage data, providing insights into the
performance and impact of our software in action.
Quantity for last 30 days
+30.00%
Quantity for last 30 days
+68.57%
Quantity for last 30 days
+11.37%
This section showcases the real-time statistics of our software in
use
across all the warehouses that have implemented it.
The figures below represent key metrics and usage data, providing insights into the
performance and impact of our software in action.